Digital Marketing KPIs: Essential Metrics to Track in 2025
Let’s be honest: digital marketing in 2025 is more complex than ever. You’ve got new platforms, smarter AI, evolving privacy laws…and a whole lot of data…
Let’s be honest: digital marketing in 2025 is more complex than ever. You’ve got new platforms, smarter AI, evolving privacy laws…and a whole lot of data. But here’s the thing: no matter how much the landscape changes, success still comes down to knowing your numbers. And that starts with tracking the key performance indicators digital marketing teams need to make smart decisions.
In my experience, the difference between a campaign that flops and one that thrives often comes down to whether or not the right KPIs were defined and tracked from the start.
First of All: What Are KPIs in Digital Marketing?
KPIs, or Key Performance Indicators, are measurable values that help you track how well your marketing efforts are performing. Think of them as your campaign’s scorecard. They show whether you’re hitting your goals (like increasing sales, traffic, leads) or if something needs fixing.
They’re different from general metrics like page views or followers. KPIs are tied to business objectives. For example:
If your goal is lead generation, your KPIs might be cost per lead or conversion rate.
If you’re running an e-commerce store, you’ll likely track return on ad spend (ROAS), average order value (AOV), cart abandonment rate, or profit.
For a content marketing strategy, KPIs might include organic traffic, time on page, or scroll depth.
In short, metrics tell you what happened, while KPIs tell you what matters.
Why KPIs Still Matter More Than Ever
With budgets under pressure and competition heating up, every click, impression, and conversion counts. But not all metrics are created equal. Vanity metrics like impressions or likes might look nice in a report, but they don’t always tell the full story.
What you really want are actionable KPIs that help you:
Understand what’s driving results
Identify what needs fixing
Justify your budget
Improve ROI
These digital marketing KPIs act like a compass. Without them, you’re flying blind.
How to Choose the Best KPIs for Your Marketing Strategy
With so many digital marketing KPIs out there, it’s easy to get overwhelmed. I’ve seen teams track everything under the sun (impressions, bounce rates, follower growth, button clicks) and then wonder why their reports feel cluttered and directionless.
So, how do you choose the right KPIs? Here’s my personal take:
Start With Your Goal
Sounds obvious, but it’s often skipped. Are you trying to generate leads? Drive sales? Increase brand awareness? Your KPI should match the outcome you care about most.
If your goal is lead generation, focus on metrics like cost per lead (CPL) and lead conversion rate. These KPIs help you measure how efficiently your campaigns are turning visitors into qualified leads.
If you’re aiming for online sales, prioritize return on ad spend (ROAS), average order value (AOV), purchase conversion rate, and profit. These metrics reveal how well your campaigns drive revenue and high-value transactions.
If your goal is engagement, look at click-through rate (CTR), video watch time, and social media shares. These KPIs indicate how your audience is interacting with your content across channels.
By selecting the right KPIs, you can optimize your campaigns, improve performance over time, and make data-driven decisions that support your broader marketing goals.
Make Sure It’s Measurable
If it can’t be tracked, it’s not a KPI but just a nice-to-have idea.
Use tools like GA4, your CRM, or ad platform dashboards to pull actual data.
Tie It to Business Impact
Avoid vanity metrics (like total likes or pageviews) unless they connect to a deeper goal. The most important digital marketing KPIs should help you make decisions and justify your budget.
Keep It Simple
Don’t overload your dashboard. In my opinion, 4 to 6 high-quality KPIs are better than 15 mediocre ones. You want clarity, not confusion.
Traffic Metrics That Actually Matter
Sure, website traffic is important. But instead of just looking at total visitors, focus on more meaningful data points like:
Source of Traffic
This tells you where your users are coming from:
Organic (Google search results)
Paid (Google Ads or Meta campaigns)
Referral (other websites)
Direct (people typing your URL or using bookmarks)
Social / Email / Display, etc.
In GA4, this shows up in the Traffic acquisition report. Personally, I check this weekly to see if paid efforts are complementing or cannibalizing organic traffic. As I’ve seen in several campaigns, a sudden spike in traffic with zero conversions is often a red flag, not a win.
P.s. make sure to check your session source / medium dimension for the most detailed overview.
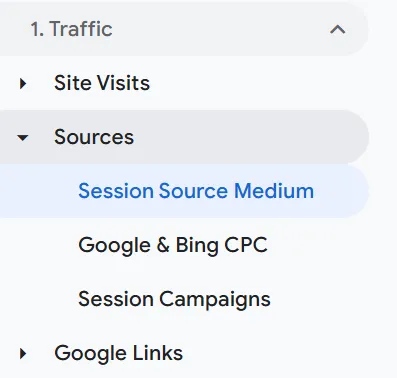
You can check your traffic source on GA4 by clicking on Session Source Medium on the sidebar menu.
New VS Returning Visitors
This metric helps you understand engagement and loyalty: are you just attracting curious one-timers, or are people coming back? A high rate of returning visitors could mean your content is actually working.
Meta Ads doesn’t break this down natively, but GA4 and Google Ads give you a clear idea. In ecommerce, high % of returning users often correlates with higher conversion rates.
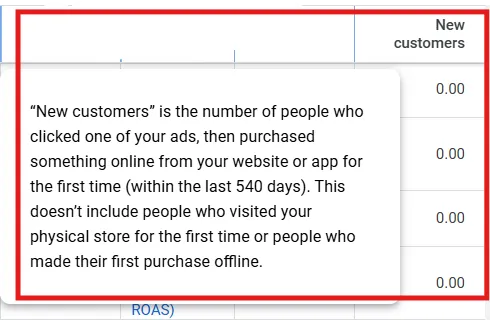
The definition of “New customers” according to Google Ads
Bounce Rate & Average Session Duration
This shows how many users stick around and interact with your content. If users land and leave in 5 seconds, something’s wrong.
For paid campaigns, this tells you whether your landing page matches the ad’s promise. If your bounce is high, that’s a sign something’s broken; maybe the page is slow, confusing, or irrelevant.
Bounce rate and other important metrics you can find on GA4.
Cost per Click (CPC)
This tells you exactly how much you’re paying every time someone clicks on your ad.
CPC = Total cost of clicks ÷ Number of clicks
In my opinion, CPC is one of those metrics that’s easy to track but tricky to judge. A low CPC sounds great (more traffic for less money, yayy)! But cheap clicks aren’t worth much if those visitors don’t convert.
I’ve seen campaigns with $0.30 CPCs that brought in junk traffic, and others with $3+ CPCs that delivered high-intent buyers.
That’s why it’s so important to always pair CPC with metrics like conversion rate or cost per acquisition (CPA). You don’t just want cheap traffic. You want qualified traffic that turns into leads or sales.
Also, CPC varies depending on the platform, industry, and competition.
Fancy a tip from my expertise? If your CPC suddenly spikes, it’s worth checking:
Are you bidding too aggressively?
Did competition increase?
Is your ad relevance or quality score dropping?
Remember: a lower CPC is better only if traffic is still qualified.
Conversion-Based KPIs You Can’t Ignore
This is where things get serious. You’re spending time and money to drive results, so your online marketing KPIs better reflect that.
Here are a few conversion-focused metrics I always track:
Conversion Rate (CVR)
This is one of my favorite KPIs because it answers the golden question: is your traffic actually doing what you want it to do? Whether you’re trying to get sales, form submissions, demo requests, or even newsletter signups, the conversion rate tells you how many of your visitors are taking action.
Conversion Rate = (Conversions ÷ Clicks) x 100
Sounds basic, right? But here’s the thing: a high conversion rate can make up for a ton of other weaknesses. I’ve seen campaigns with average CPCs and mid-level traffic completely crush it just because the landing page was so well-optimized and matched the user’s intent perfectly.
What’s a “good” conversion rate?
Honestly, it depends. From my experience, if your conversion rate is under 1%, something needs fixing; maybe your landing page is too slow, your offer isn’t clear, or your traffic isn’t qualified.
What I’d recommend is to always segment your conversion rate by source, device and country. The same landing page might convert 9% from email traffic and only 2% from paid social. That insight helps you optimize smarter, not harder.
Let’s start from here: not all leads are created equal.
Getting leads is great. But let’s be real, not all leads are worth the same. That’s where lead quality comes in.
You don’t want to just measure how many people fill out a form! You want to know how many of them are actually a good fit for your product or service.
In my experience, campaigns that focus only on volume tend to attract “junk leads.” People who aren’t ready to buy, who ghost after the first email, or who clicked just because your ad looked cool.
How do you measure lead quality? Track how many leads turn into real opportunities or customers and ask your sales team for feedback (seriously, they always know). You can do this through a CRM, or tools like WhatConverts in case you receive phone leads too. WhatConverts even lets you inject actual closed deals data back into your ad platforms.
Now let’s talk about the bigger picture: Customer Lifetime Value (LTV). This KPI tells you how much revenue you can expect from a customer over the entire time they do business with you. It’s especially important if you sell subscriptions, services, or have strong repeat business.
LTV = Average Purchase Value x Purchase Frequency x Customer Lifespan
Why does this matter? Because it tells you how much you can afford to spend on acquiring a customer. If your LTV is $1,000, spending $150 to acquire that customer could be a smart move. But if LTV is only $50, spending $150 would be a disaster.
When you combine LTV with Cost Per Acquisition (CPA), you get a real sense of profitability. I’ve seen businesses completely shift their strategy after realizing their highest-LTV customers were coming from unexpected channels.
Quick tip: Lifetimely is a great app for measuring LTV among Shopify users, whereas Metorik is ideal for WordPress users.
Cost per Conversion (CPA/CPL)
When it comes to paid media campaigns, two of the most important metrics (and often used as KPIs) are CPL (Cost Per Lead) and CPA (Cost Per Acquisition).
The CPA (Cost per Acquisition) tells you how much it costs to acquire a paying customer (or whatever your final goal is: a purchase, signup, subscription, etc.).
CPA = Total Ad Spend ÷ Number of Conversions
CPL stands for ‘Cost per Lead’ and follows the same formula; this is used when we talk about lead generation. It is how much you’re paying to get a new lead (like someone filling out a contact form, downloading a guide, or signing up for a newsletter).
Here’s why I always include these in reporting dashboards:
They give you a clear cost-efficiency benchmark
They help you compare channels (e.g. Google vs Meta vs Bing)
They show how scalable your campaigns are (Have you ever heard of incremental CPA? It’s the extra cost you incur to acquire just one more customer)
I’ve worked on campaigns where a high CTR and strong conversion rate looked great, but the CPA was too high to justify the spend. Once we reduced CPA, profit margins increased dramatically, without even changing the product or offer.
What’s a good CPA or CPL?
It totally depends on your industry. Again, the real question is: Does your CPA or CPL make sense compared to your average order value or customer LTV and business costs?
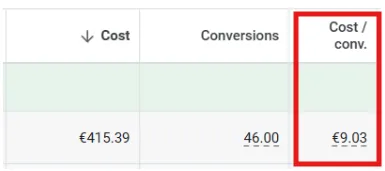
You can find CPA or CPL under the Cost / conv. column on Google Ads.
Engagement Metrics That Tell the Real Story
Engagement isn’t just for social media: it matters across the entire customer journey. From how long someone watches your video ad, to whether they open your emails, these behaviors give you insight into user intent.
Click-through Rate (CTR)
The click-through rate (CTR) measures the percentage of people who clicked on your ad or email after seeing it. Here’s the formula:
CTR = (Total Clicks ÷ Total Impressions) x 100
For email marketing, CTR shows how well your subject line, email copy, and CTA are resonating with your audience. A high CTR means people are opening your emails and taking the next step, whether that’s reading a blog, buying a product, or signing up for a webinar.
For paid ads, whether on Google, Meta, or other platforms, CTR shows how well your ad copy, targeting, and visuals work together to attract attention. A low CTR often signals that your ad isn’t relevant or engaging enough for the audience you’re targeting.
Both for ads and emails, CTR tells you if your message is cutting through the noise and encouraging people to take action. A low CTR means you might need to revisit your creative, messaging, or targeting. A high CTR, however, means you’re reaching the right people with the right offer.
What if you have a low CTR? You may ask yourself how you can improve it. Well, these are my recommendations:
Test your creatives: A/B testing is your friend. Test different headlines, images, and CTAs to see what resonates best with your audience.
Refine targeting: make sure you’re showing your ads to the right people. Use audience segmentation in Meta or Google Ads to improve relevance.
Optimize timing: for emails, timing matters. Test different send times to see when your audience is most likely to engage.
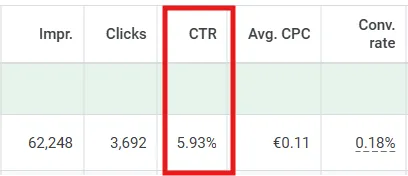
How CTR looks like on Google Ads.
Watch Time
Watch Time refers to the total amount of time viewers spend watching your video ads. In the context of YouTube, it’s a key metric because YouTube rewards content with higher watch times. This means that if your ad has a high watch time, it will likely get a better placement, resulting in a more efficient campaign with lower costs per view.
Just a couple of tips on my side to improve this metric:
Hook viewers early: you only have a few seconds to grab attention, so make those first few moments count! Get straight to the point and show the value.
Storytelling: ads that tell a compelling story tend to keep viewers engaged longer. Create an emotional connection or provide useful information that keeps people watching.
Targeting: ensure your ads are shown to the right audience. If you target too broadly, you might be getting views from people who have no interest in your message, resulting in low watch time.
Video length: keep your ads concise and to the point. While skippable ads allow viewers to leave after 5 seconds, non-skippable ads should deliver value right from the start.
This measures how your audience interacts with your posts over time. Whether you’re on Facebook, Instagram, Twitter, or LinkedIn, engagement is a direct reflection of how well your audience resonates with your content, and how active they are in responding to it.
Engagement rate on social media is typically calculated by taking the total interactions (likes, comments, shares, and sometimes clicks) on a post and dividing it by the total number of followers or impressions. The formula is:
Engagement Rate = (Total Interactions ÷ Total Followers or Impressions) × 100
This metric is a powerful way to measure how compelling your content is to your followers and how likely they are to take action.
ROI and Efficiency Metrics to Keep You Accountable
If you’re running campaigns and not measuring ROI, stop everything and fix that first.
Return on Ad Spend (ROAS)
When you’re running paid campaigns, whether on Google Ads, Meta Ads, or any other platform, Return on Ad Spend (ROAS) is one of the most important metrics to track. It tells you whether the money you’re spending on ads is actually generating enough revenue to justify the investment.
ROAS stands for Return on Ad Spend, and it measures the revenue you earn for every dollar spent on advertising.
ROAS = Revenue from Ads ÷ Cost of Ads
ROAS measures profitability, and it helps you understand if your ad spend is providing a positive return or if it’s just burning through your budget.
In my opinion, a “good” ROAS can vary depending on your industry, margin, and overall business model. Achieving a strong one isn’t always easy, but you always need to test & refine: A/B test your ad creatives, headlines, and CTAs to see what resonates best with your audience. Small changes can lead to big improvements.
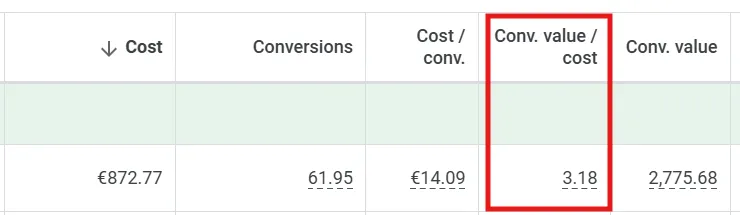
You can find ROAS on Google Ads as “Conv. value / cost”.
Marketing Efficiency Ratio (MER)
MER looks at all revenue vs. all marketing spend.
MER = Total Revenue ÷ Total Marketing Spend
It’s perfect for high-level decisions. I use it when evaluating full-funnel campaigns, where you might be running Meta, Google, Bing, e-mail, all at once.
MER gives you an overall view of your marketing efficiency. Unlike ROAS, which focuses on individual channels like Google Ads or Meta Ads, MER looks at your entire marketing spend across all channels (paid ads, organic efforts, influencer partnerships, email marketing, etc.). It helps you understand if your entire marketing strategy is working as a whole.
With MER, you can quickly evaluate whether your marketing budget is being used efficiently. A low MER could indicate that you’re overspending on marketing without seeing a proportional return, while a higher MER shows you’re maximizing your spend effectively.
Are you confused? You may ask yourself, what’s the difference between MER and ROAS, then?
While ROAS (Return on Ad Spend) measures the revenue generated from a specific campaign or platform, MER gives you a holistic view of how all your marketing efforts are performing. ROAS is perfect for tracking individual ad campaigns, while MER is ideal for evaluating the efficiency of your entire marketing strategy.
ROI (Return on Investment)
While ROAS focuses only on ad performance, ROI takes everything into account (including production costs, tools, fees, etc.)
Return on Investment (ROI) is a performance measure that evaluates the efficiency of an investment, in this case, your marketing spend. ROI helps you understand if the money you’re investing in marketing is bringing back enough revenue to justify the cost.
ROI = (Revenue – Total Costs) ÷ Total Costs
If you’re investing in content creation, design, freelancers, or platforms like Shopify, ROI gives you the full picture. It’s harder to calculate than ROAS, but much more realistic when you want to understand profitability.
What’s the difference between ROAS and MER, then?
While ROAS is ideal for evaluating specific ad campaigns, letting you know if your paid ads are delivering a strong return, ROI takes a broader view by accounting for all costs, including the cost of goods sold, overheads, and other business expenses. On the other side, MER gives you a big-picture view of how efficiently you’re using your marketing budget to drive revenue.
Choose KPIs That Align With Your Goals
Not all businesses need the same KPIs. An e-commerce brand will track sales per session, while a B2B SaaS company might care more about cost per SQL. What matters is choosing KPIs that match your business goals and customer journey.
If you’re not sure what to track, that’s okay it can get overwhelming. In fact, many brands I’ve worked with started with 20+ metrics and ended up focusing on 4-5 that actually moved the needle.
Final Thoughts
At the end of the day, digital marketing KPIs are not just numbers; they’re signals. They help you understand if your strategy is working, or if it’s time to pivot. And in 2025, staying agile and data-driven is everything.
So if you’re serious about growth, make sure you’re tracking the right key performance indicators that digital marketing campaigns depend on.And don’t forget, Midsummer Agency is here to help. Do you need more information? Check out our PPC services or contact us directly!