

Web Analytics
Building A First-party Data Strategy For Ecommerce After The Cookie
Third-party cookies are gone and platform signals keep shrinking. We show you what data to collect first, how to activate it, and where it outperforms.
Read MoreeCommerce attribution decides which marketing touchpoint gets credit for a sale, but the “right” model depends entirely on your traffic and channel mix. Here’s a practical…


TL;DR: eCommerce attribution assigns credit for a sale across marketing touchpoints, but there’s no single “best” model, it depends on your monthly conversion volume and channel mix. Under 500 conversions a month, lean on last-click as a baseline and let MER (Marketing Efficiency Ratio) do the real work. Between 500 and 2,000 conversions across four to six channels, GA4’s data-driven attribution starts earning its keep. Above $10M in revenue with six or more channels, layer Marketing Mix Modeling on top. Whatever model you choose, pair it with incrementality testing and blended MER to catch the double-counted credit that platforms like Meta and Google structurally over-report.
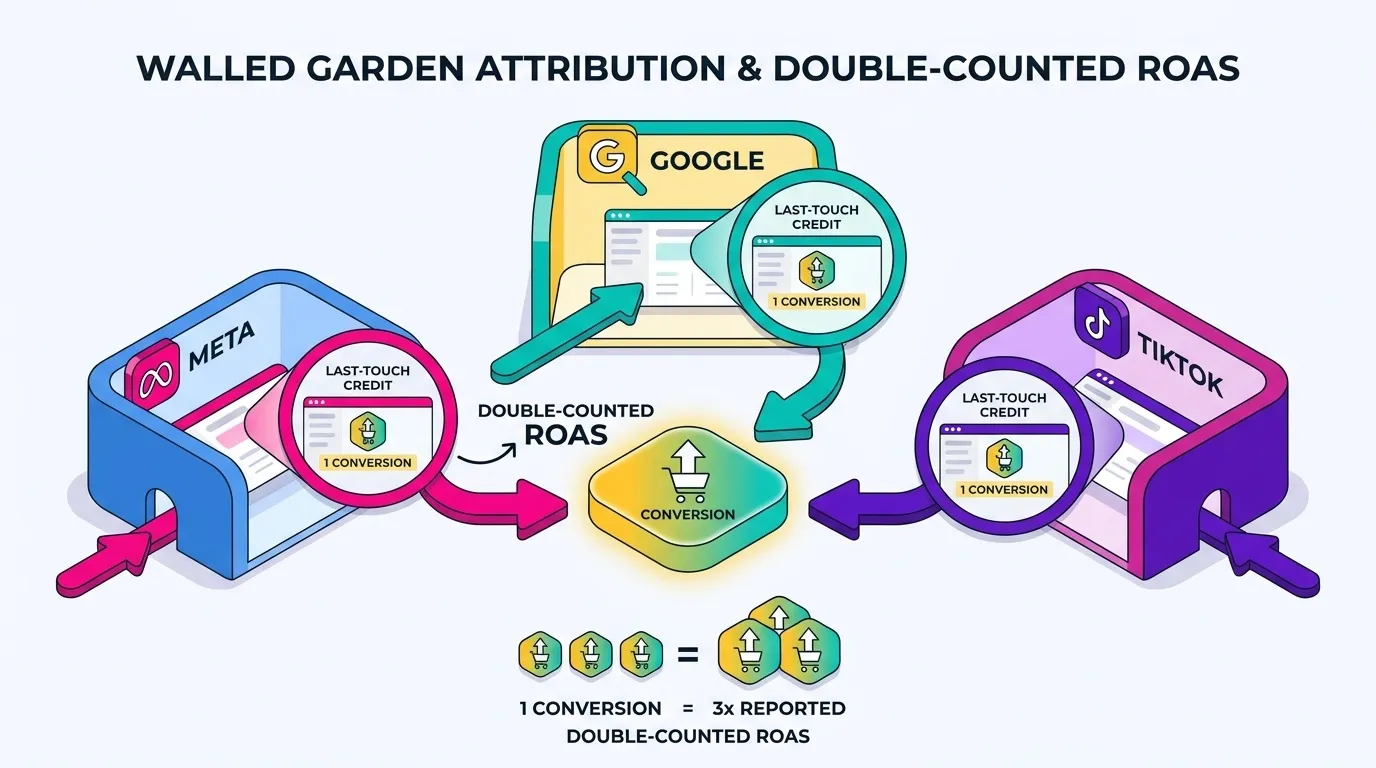
Meta says it drove the sale. Google Ads says it drove the sale. Your affiliate partner says it drove the sale too. Meanwhile, your CFO is asking a much simpler question: which one is actually telling the truth?
If that scenario feels familiar, you’re in exactly the right place. Every scaling DTC brand runs into this wall eventually, usually right around the point where monthly ad spend gets large enough that “good enough” reporting stops being good enough.
With customer acquisition costs climbing across almost every vertical, misattributed spend is margin walking out the door if budget keeps getting allocated based on numbers that were never designed to be compared against each other in the first place. Our guide on how to maximize eCommerce profit digs deeper into where that kind of margin normally leaks once you start looking past top-line revenue.
Every ad platform is incentivized to over-credit itself. Meta wants to look good in Meta. Google wants to look good in Google Ads. None of them are lying exactly, they’re just each telling their version of the story, which is why in-platform ROAS is unreliable by design. Having said that, if you want to know my 2 piece of cents: Meta does like attributing to itself a little more aggressively. In this article, I’m not going to hand you a glossary of attribution models and wish you luck. I’m going to give you a decision framework for choosing the model that actually fits your traffic volume, your channel mix, and your sales cycle, because that’s the part most articles on this topic skip entirely.
Let’s start with a plain definition, because a surprising number of teams use the word “attribution” without ever agreeing on what it means. eCommerce attribution is the method of assigning credit for a conversion to the marketing touchpoints that contributed to it. That’s it. It’s not tracking, and it’s not a magic truth detector. It’s a set of rules, applied to data, that produces a specific answer to the question “who gets the credit here?”
This distinction matters more than it sounds. Tracking is the act of capturing that an event happened: a click, a session, a purchase. Attribution is the separate decision layer that determines which source gets credit for the outcome. You can have flawless tracking and still have broken attribution, because attribution is a modeling choice, not a data collection problem. I see teams debug their pixels for weeks trying to “fix” numbers that were never a tracking issue to begin with, they were a model logic issue.
Once you separate those two concepts, a lot of confusing reporting conversations start making sense. Your GA4 events can be firing perfectly and your Shopify checkout can be tracked flawlessly, and you can still get wildly different revenue numbers in three different dashboards. “Unfortunately” it’s not a bug, it’s just three different attribution logics disagreeing with each other – which is what sometimes makes it hard to decide what model to trust.
Attribution was never perfectly accurate, even in what people nostalgically call “the good old days” of third-party cookies. Cross-device journeys were always partially invisible, and offline touchpoints were always approximated at best. The difference is that the old system was good enough for directional decisions, and the margin of error was smaller because more of the signal actually made it through.
Then Apple’s App Tracking Transparency framework arrived with iOS 14.5, and cross-app tracking on iOS effectively required explicit opt-in. Industry estimates commonly cite opt-in rates in the range of 25 to 40 percent depending on vertical, which means a meaningful chunk of your iOS-heavy audience is now structurally invisible to platform-side attribution. Safari’s Intelligent Tracking Prevention added another layer of erosion for cross-session tracking, and browser-level cookie restrictions have continued tightening the funnel ever since.
Consent Management compounds this. Every visitor who declines cookie consent shrinks the data pool your attribution models are built on. Smaller sample, less reliable model output, that relationship is direct and unavoidable. It’s a bit like trying to read a room’s mood after half the people left before the conversation started. You can still form an opinion, but you should hold it more loosely than you used to.
So what is the best attribution model for eCommerce? There isn’t a single universal answer, and I’d be skeptical of anyone who gives you one. Data-driven attribution (GA4’s default model) works well once you have sufficient conversion volume – generally 500 or more per month. Below that threshold, the model is still making educated guesses with limited signals, which makes it harder to trust the credit it assigns. In that case, I recommend a hybrid approach: last-click as your deterministic baseline (not because it’s accurate – it over-credits bottom-of-funnel touchpoints like branded search and retargeting – but because its biases are predictable and well-understood, so you always know which direction it’s wrong in), incrementality testing where feasible, and MER (Marketing Efficiency Ratio) as your north star, because it doesn’t depend on trusting any single model’s credit assignment. Together, each method compensates for the others’ blind spots. For deeper context on how tracking infrastructure feeds into all of this, our guide on what web analytics is and how to track website performance is a useful starting point.
Before we get into which model fits which brand, let’s lay out the full menu. Think of this section as the ingredients list before I tell you which recipe to actually cook – and yes, working for an Italian agency, I can say we take both our attribution models and our ingredient lists very seriously.
Last-click attribution gives 100 percent of the credit to the final touchpoint before conversion. It became the historical default largely because it’s simple to compute and it’s what most ad platforms report natively. First-click attribution does the opposite, crediting the very first touchpoint in the recorded journey, regardless of what happened afterward.
Both have obvious blind spots. Last-click systematically overvalues bottom-funnel channels like branded search and retargeting, the touchpoints that happen to be standing closest to the finish line when the customer decides to buy. First-click, conversely, overvalues top-of-funnel discovery channels and gives zero credit to everything that nurtured the customer along the way. Neither model reflects reality particularly well, but they’re still useful as quick sanity checks precisely because they’re transparent and easy to explain to a non-technical stakeholder.
Multi-touch attribution (MTA) splits credit across multiple touchpoints instead of handing it all to one. Linear attribution distributes credit evenly across every touchpoint in the path. Time-decay attribution gives more credit to touchpoints closer to the conversion, on the logic that recent interactions likely mattered more. Position-based (U-shaped) attribution gives extra weight to the first and last touchpoints, with the middle interactions splitting whatever credit remains.
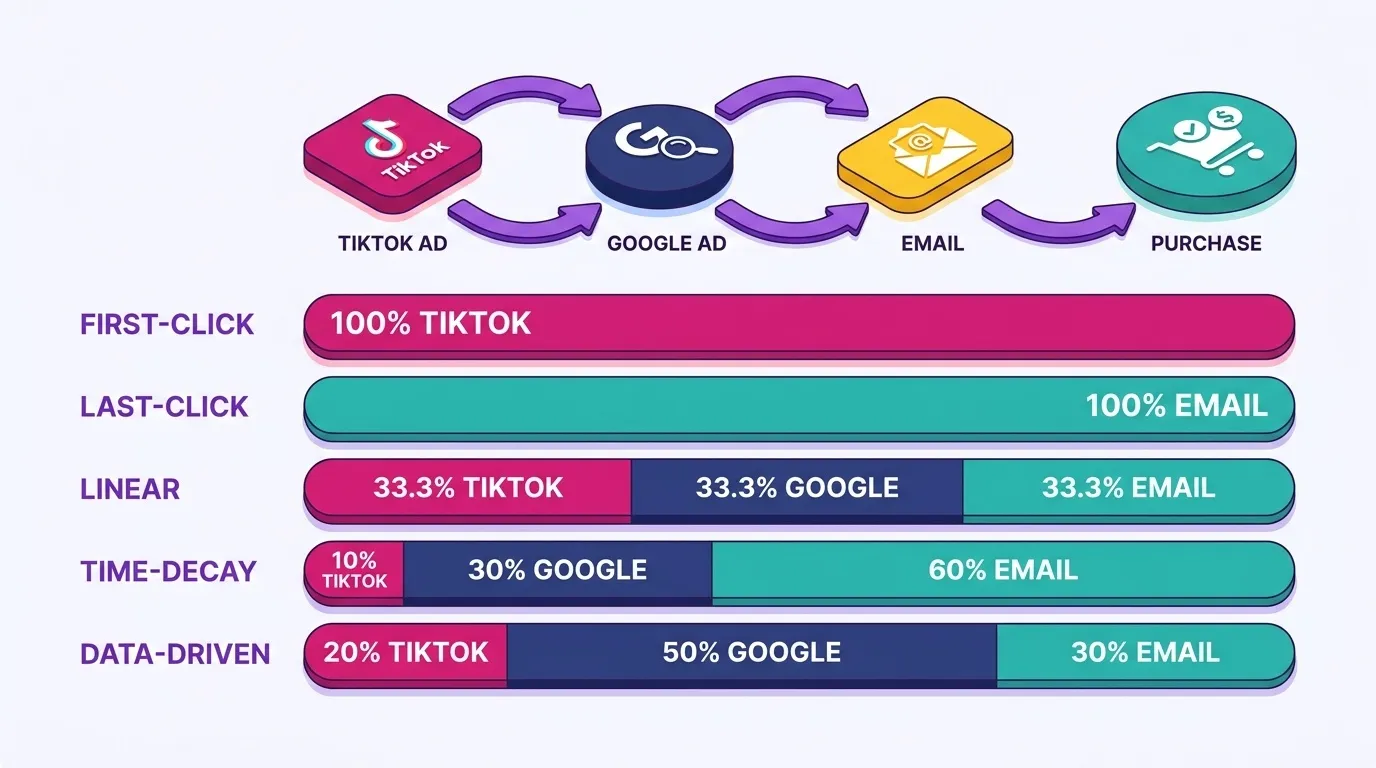
Here’s a concrete example to make this less abstract. Imagine a customer sees a TikTok ad on Monday, clicks a Google Ad three days later while researching, and finally converts via an email flow the following weekend. Last-click hands 100 percent to email. First-click hands 100 percent to TikTok. Linear splits it evenly three ways. Time-decay favors email but still credits Google Ads and TikTok proportionally less. Position-based gives TikTok and email the lion’s share and lets Google Ads pick up whatever’s left in the middle. Same customer, same journey, five completely different “truths” depending purely on which model you chose.
Data-driven attribution (DDA) is GA4’s default model, and it works differently from every rule-based option above. Instead of applying a fixed formula, it analyzes patterns across your account’s actual converting and non-converting paths, and estimates each touchpoint’s counterfactual contribution: essentially, how much less likely was this conversion to happen without this specific touchpoint present. It’s a more sophisticated approach, but it comes with a dependency the rule-based models don’t have: it needs enough historical conversion data to learn from, which we’ll get into in the next section. For the technical details on how this counterfactual modeling actually works, Google’s own documentation on data-driven attribution breaks down the methodology in more depth than we can cover here.
Marketing Mix Modeling (MMM) takes a completely different angle. Rather than tracking individual users across touchpoints, it works at an aggregate level, correlating overall marketing spend by channel against overall sales over time, often incorporating offline channels, promotional calendars, seasonality, and even macroeconomic factors like consumer confidence or inflation. Because it doesn’t rely on user-level tracking at all, it’s immune to cookie deprecation and consent rate fluctuations.
The tradeoff is that it needs a longer time horizon (typically 2–3 years of consistent weekly data), sufficient spend diversity across at least four or five channels, and enough natural variation in budgets – periods where spend ramped up, pulled back, or shifted between channels – for the model to isolate the contribution of each one. If a brand spends roughly the same amount on the same channels month after month, there simply isn’t enough signal for the model to decompose. That makes MMM a better fit for mature, high-volume brands with diversified media mixes than for a store doing its first six figures on one or two paid channels.
The good news is that the barrier to entry has dropped significantly: open-source tools like Google’s Meridian, Meta’s Robyn, and PyMC-Marketing have made MMM accessible without a dedicated data science team, though interpreting the outputs still requires statistical literacy. And the outputs themselves are directional – “shift 15% of display budget into paid search” – rather than exact per-click attribution numbers, which means MMM works best as a complement to platform reporting, not a replacement for it.
| Model Type | How Credit Is Assigned | Best For | Data Volume Needed | Main Limitation |
|---|---|---|---|---|
| Last-Click | 100% to final touchpoint | Simple, low-volume stores | Any volume | Overvalues bottom-funnel |
| First-Click | 100% to first touchpoint | Diagnosing discovery channels | Any volume | Ignores nurture/closing channels |
| Linear | Equal split across path | Balanced, simple mid-funnel view | Moderate | Ignores true impact weighting |
| Time-Decay | More credit near conversion | Shorter sales cycles | Moderate | Still undervalues early discovery |
| Position-Based (U-Shaped) | Heavy weight on first & last | Longer, multi-stage journeys | Moderate to high | Arbitrary mid-path weighting |
| Data-Driven (GA4 default) | ML-estimated counterfactual credit | 500+ conversions/month, 4+ channels | High | Noisy below volume threshold |
| Marketing Mix Modeling | Aggregate spend-vs-sales correlation | $10M+ revenue, offline + online mix | Very high (time & spend) | Slow to react, needs long time series |
“AI attribution” gets thrown around a lot lately, often as a marketing term rather than a technical one. It’s worth unpacking what’s actually happening under the hood, because the answer determines how much you should trust it.
Data-driven attribution works by comparing converting paths against non-converting paths across your account. In simplified terms, it looks at thousands of customer journeys, some that ended in a purchase and some that didn’t, and estimates how much each touchpoint’s presence changed the odds of conversion. This is conceptually similar to Shapley value logic from game theory, where credit is distributed based on each player’s marginal contribution to the outcome. You don’t need to understand the math to use it well, but it helps to know that it’s pattern-matching against your own historical data, not applying some universal formula pulled from nowhere.
That’s an important nuance, because “AI attribution” isn’t magic, and it isn’t objective truth either. It’s a model trained on your account’s specific conversion history, and its accuracy is entirely bounded by how much data it has available to learn from. A model trained on a thin dataset will produce thin, unstable conclusions, no matter how advanced the underlying algorithm is.
Where this approach shines is in capturing non-linear interaction effects that rule-based models simply can’t see. Consider a channel that almost never gets last-click credit but consistently shows up early in converting paths, quietly doing the work of making every later touchpoint more effective. A linear or time-decay model treats that channel mechanically. A data-driven model can actually detect that pattern and credit it accordingly.
In practice, I typically see this play out clearly for brands with 1,000 or more monthly conversions running four or more active channels. At that volume and complexity, the data-driven model consistently produces more nuanced, more actionable credit allocation than any fixed-rule heuristic could. Below that threshold, though, the advantage shrinks fast.
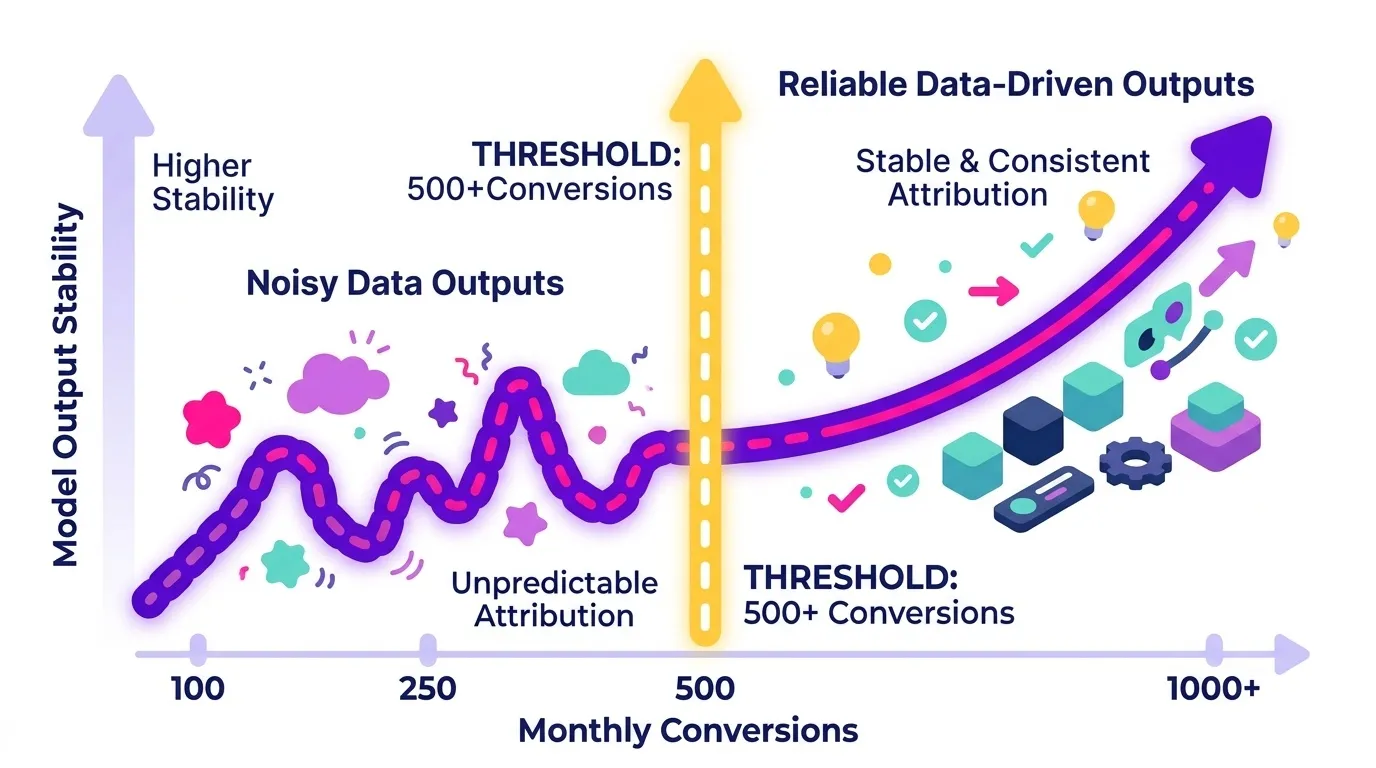
Here’s the limitation, and it’s what vendors that are selling “AI-powered attribution” tend to gloss over. Low-volume accounts produce noisy, unstable model outputs, simply because there aren’t enough conversion paths for the algorithm to learn from reliably. I’ve watched data-driven attribution percentages swing meaningfully month to month for accounts under a few hundred conversions, not because channel performance actually changed, but because the model was re-learning on a thin, statistically shaky sample.
My two cents: treat AI-driven attribution outputs as a directional signal to combine with incrementality checks, not as gospel, particularly for brands under roughly 500 conversions per month. Above that threshold, trust it more, but still sanity-check it against blended metrics. Think of it like a guard dog that barks at every single person who walks by. After one bark, you have no idea whether there’s an actual threat. But if the dog barks at 500 people and you notice it only goes truly aggressive with the three who later turned out to be burglars – now you’re calibrating how much to trust its reactions. Small sample, low confidence. Larger sample, higher confidence. Same logic applies here.
This is the part most competitor articles skip, but it may be the part that matters most. Two variables drive the decision more than anything else: your monthly conversion volume and the number of active marketing channels you’re running simultaneously.
If you’re running under 500 conversions per month across two or three channels, resist the temptation to use a fancy multi-touch or data-driven setup if you have difficulty understanding them. At that volume, these models could only create noise. Your pragmatic default should be last-click reporting as a baseline (if you have few conversions, you usually also have a weaker bottom funnel anyways), paired with MER as your real performance check. It’s not glamorous, but it’s honest, and honest beats sophisticated when the underlying sample is thin.
Once you’re in the 500 to 2,000 conversions per month range across four to six channels, GA4’s data-driven attribution starts becoming interesting. This is the sweet spot where the model has enough historical paths to learn from, but you should still run periodic incrementality spot-checks (more on that shortly) to validate that the algorithmic output matches reality.
Brands doing $10M or more in revenue or enough conversions, with six-plus channels, including offline or retail touchpoints, benefit from layering Marketing Mix Modeling on top of data-driven attribution. MMM gives you the aggregate, privacy-proof view that catches brand-building and offline halo effects that user-level models structurally can’t see, while data-driven attribution still handles the granular day-to-day digital optimization.
Here’s the part that trips people up: the “right” model at $2M ARR will actively mislead you at $15M ARR. As channel count grows and conversion volume compounds, the assumptions baked into a simpler model stop holding. A last-click setup that was perfectly serviceable with two channels becomes dangerously misleading once you’ve added paid social, affiliate, influencer seeding, and SMS on top of paid search.
Model selection isn’t a “set it and forget it” decision. I’d revisit it at every meaningful growth inflection point: launching a new paid channel, scaling paid social spend significantly, or crossing a volume threshold that unlocks a more sophisticated model’s reliability. Treat it the way you’d treat gear shifting on a mountain road. The gear that got you up the first climb isn’t the one you want for the descent.
These two concepts get conflated constantly, but they answer fundamentally different questions. Attribution maps correlation – it sees which touchpoints were present in a converting path and distributes credit across them. Incrementality measures causation – it tells you how much of that revenue actually wouldn’t have happened without the channel in question.
The distinction matters because attribution, no matter how sophisticated the model, cannot tell you whether a sale would have happened regardless. That requires a controlled comparison, not a credit-splitting formula. A channel can look like a hero in your attribution dashboard while contributing almost nothing incremental – branded search is the classic example.
The gold-standard method here is a geo-holdout or audience-holdout test: turning off a specific channel for a defined subset of your audience or geography, then comparing conversion rates against the group that still saw the ads. If conversion rates barely move without the channel, its “true” incremental contribution is much smaller than its attributed credit suggested. This is genuinely the closest thing to ground truth in performance marketing, and it’s worth understanding even if you can’t run it constantly.
The practical barrier is real, though. Most $1-20M brands simply don’t have the traffic volume to run a statistically clean holdout test without waiting months to reach significance, and pausing a channel for that long has real opportunity cost. This is where a lot of teams either give up on incrementality entirely or run underpowered tests and draw false conclusions from noise.
Theory is only useful once it’s configured correctly. Let’s walk through where this actually lives inside GA4.
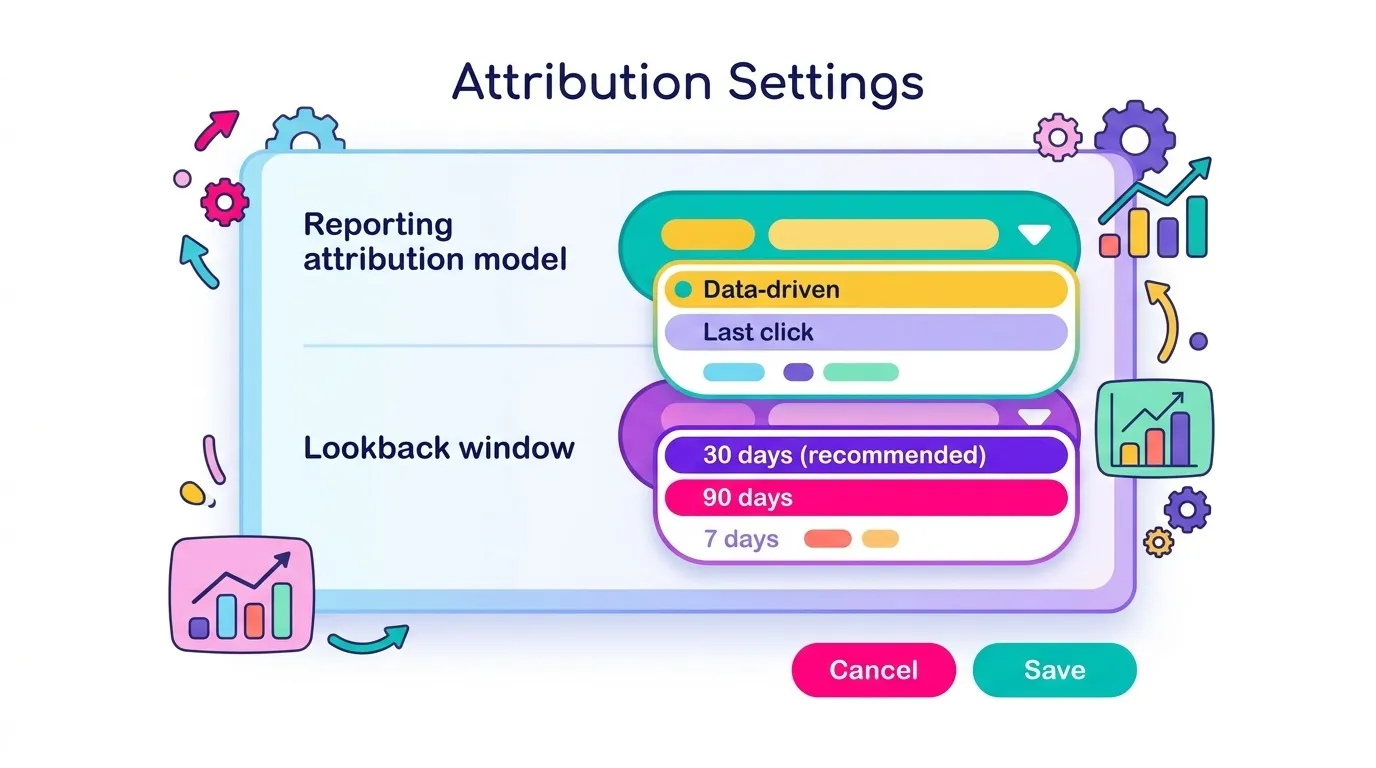
Inside GA4, go to Admin > Data Display > Events > Attribution settings. From there, you’ll choose your reporting attribution model, which determines how conversions are credited across your standard reports. Data-driven is the default and, for most brands above our earlier volume threshold, the recommended choice. Last click is still available, while other legacy models have been deprecated.
GA4 defaults to a 90-day lookback window for most conversion events. Whether that’s right for you depends heavily on your sales cycle. A beauty brand selling an impulse-purchase serum probably converts most customers well within a week or two, and a 90-day window could potentially dilute credit across touchpoints that were never really relevant. A home or wellness brand selling a considered $400 purchase, on the other hand, might genuinely need the full 90 days, or longer, to capture the real research-to-purchase journey. Check your own path-length data before assuming the default fits your business.
The most common mistake I see is leaving properties disconnected: not linking Google Ads to GA4, or skipping enhanced conversions setup, which silently degrades the very data the model depends on. If you’re still working through the basics of getting Google Ads conversions to work properly, our guide on creating Google Ads conversions for Shopify walks through the setup correctly.
The second common mistake is ignoring Google’s Consent Mode configuration entirely, then wondering why attributed conversions look thinner than expected. Also don’t forget about advanced consent mode, which can help recover a significant portion of that lost signal by sending cookieless pings to Google, which it then uses to model the conversions it couldn’t directly observe.
The third, and probably the most damaging in terms of decision-making, is comparing GA4’s attributed conversions directly against Meta Ads Manager’s reported conversions without acknowledging they use fundamentally different attribution logic. Meta’s platform reporting typically uses its own last-touch, in-platform windows that structurally inflate its own contribution. Comparing that number against GA4’s data-driven output isn’t an apples-to-apples comparison.
No matter which model you land on, I’d recommend anchoring your monthly reporting to one metric that doesn’t depend on trusting any single platform’s credit assignment: Marketing Efficiency Ratio (MER).
MER is simply total revenue divided by total marketing spend across all channels combined. It’s blunt by design, and that’s exactly its value. It doesn’t care whether Meta says it drove the sale or Google says it drove the sale, because it’s looking at the whole picture, not any individual channel’s self-reported story.
This matters precisely because it sidesteps the entire attribution debate. I’ve seen brands post “great” ROAS across every single channel individually, each platform reporting healthy in-platform numbers, while blended MER quietly declines month over month. That combination is a red flag: it usually means attribution is being double-counted across platforms, or budget is chasing already-warm demand rather than generating new demand.
I don’t recommend MER as a replacement for a proper attribution model, but as a monthly north-star check that runs alongside whatever model you’ve chosen. Healthy MER benchmarks vary by vertical and business stage, so I’d avoid chasing a specific number pulled from someone else’s business, but tracking your own trend line over time tells you far more than any single month’s snapshot. For the underlying math, our breakdown of break-even ROAS and how to calculate it pairs well with MER as a combined margin-and-efficiency check, and our free MER calculator is a quick way to get a live read on where you stand today.
Let’s consolidate the pitfalls I see most often into something scannable, because most of these mistakes are avoidable once you know to look for them.
Last-click defaults systematically overvalue branded search and retargeting, the touchpoints standing closest to the finish line. The practical consequence is that brands sometimes may cut prospecting budgets based on “poor ROAS” that was actually just under-credited by the model, not genuinely underperforming. That’s a costly mistake, because it usually means the brand is quietly starving the exact channel responsible for generating the demand that branded search and retargeting later closed.
GA4’s assisted conversion reporting shows which channels appear in a converting path without necessarily being the final touch. Ignoring this data undervalues awareness and social channels specifically. A Meta prospecting campaign that rarely earns last-click credit, for example, might consistently show up early in converting paths, doing exactly the discovery job it was designed to do, and getting almost no reporting credit for it.
Mismatched lookback windows and reporting periods create false month-over-month volatility that leads to reactive, poor budget decisions. If your model’s lookback window is set to 90 days but your team reviews performance weekly, you’ll see noisy swings that have nothing to do with actual channel performance. The fix is straightforward: align your lookback window to your brand’s actual average purchase cycle length, which you can check directly in GA4’s own path exploration data, rather than leaving the default in place indefinitely. For a deeper look at how retargeting specifically interacts with this reporting distortion, our comparison of retargeting versus remarketing is worth a read.
Everything above comes together in how we actually set this up for clients. We don’t pick a single model and call it done, because no single model deserves that level of trust on its own.
No single tool gives you a complete picture of attribution. What works is layering three complementary approaches, each compensating for the blind spots of the others.
The first layer is GA4’s data-driven attribution. It’s the most sophisticated model available natively inside the platform most brands already use, and it does a reasonable job of distributing credit across touchpoints – as long as it has enough data to work with. For brands in the $1–20M range, it’s the right starting point.
The second layer is server-side tracking through tools like Stape.io and server-side Google Tag Manager. This recovers signal that would otherwise be lost to consent gaps, ad blockers, and browser restrictions. It doesn’t change how credit is assigned – it makes sure GA4 and ad platforms actually see the events it needs to assign credit in the first place. Without this layer, your attribution model is making decisions based on incomplete data.
The third layer is the one most teams skip: heuristic sanity checks. This means tracking blended metrics like Marketing Efficiency Ratio (total revenue ÷ total ad spend) over time, comparing total platform-reported conversions against actual orders in your store, and asking the basic question – when we scaled this channel, did total revenue actually move? These aren’t sophisticated, but they catch the moments when a model is confidently wrong and nobody’s questioning it. If your attribution model says Meta had a record month but blended MER didn’t budge, something in the model is off.
This layered structure fits the $1-20M DTC brand specifically because it matches where these businesses actually sit: enough data volume to genuinely benefit from a data-driven model, but not enough to blindly trust every output without a human cross-check. That’s a very different reality than either a small brand with three channels and thin data, or an enterprise brand with the volume and budget to run statistical holdout tests on demand.
And none of this is static. Model selection gets revisited every time a brand’s channel mix shifts meaningfully – launching a new paid channel, scaling into international markets, or crossing a volume threshold that unlocks a more reliable model. What works at €80K/month in ad spend may not work at €300K.
We worked with a beauty DTC brand that had been aggressively cutting prospecting budget on Meta for two straight quarters based on declining in-platform ROAS. Once we rebuilt their GA4 attribution setup, enabled server-side tracking to recover lost iOS signal, and cross-checked the corrected data-driven output against blended MER, the picture flipped. Prospecting wasn’t underperforming, it was under-credited. Reallocating budget back toward top-of-funnel, guided by the corrected model rather than the platform’s self-reported number, moved blended MER in the right direction within the following reporting cycle. If you’re facing a similar gap between what your platforms report and what your P&L actually shows, our Web Analytics services are built exactly for this kind of diagnostic work.
There is no universal “best” attribution model, and I’d genuinely be wary of anyone who claims otherwise. There’s only the model that matches your current data reality: your traffic volume, your channel complexity, and your actual sales cycle. What works today may actively mislead you at double the revenue.
Attribution should inform decisions, not dictate them blindly. Pairing whatever model you choose with MER as a blended sanity check, and with periodic incrementality checks where feasible, is the pragmatic standard I’d hold any scaling brand to, regardless of budget size.
As privacy constraints keep tightening, and they will keep tightening, the brands that build genuine attribution literacy now will consistently make better budget decisions than the ones still chasing a mythical “perfect” model that fits every business equally. Precision that doesn’t match your data reality isn’t precision at all, it’s just a more convincing-looking guess.
A simple first step, and it costs you nothing: open your GA4 property this week and check which reporting attribution model and lookback window are actually configured. You might be surprised at what’s been driving your reports all along. And if you want to keep building out your measurement foundation from here, our guide to essential digital marketing KPIs to track is a natural next read.
Ready to find out whether your current attribution setup is helping you make good decisions or quietly steering you wrong? Explore our Web Analytics services or request a personalized audit of your GA4 and tracking infrastructure.
We’ll dig into your data, identify where the signal is leaking, and make sure the numbers guiding your budget decisions actually reflect what’s happening in your business.