

Web Analytics
Building A First-party Data Strategy For Ecommerce After The Cookie
Third-party cookies are gone and platform signals keep shrinking. We show you what data to collect first, how to activate it, and where it outperforms.
Read MoreGeo-lift tests and holdout experiments let smaller DTC brands measure the real incremental impact of ad spend without an enterprise MMM budget. Here is how to…


Geo-lift testing measures the real incremental impact of your ad spend by comparing matched markets where ads are running against markets where they are paused. Its simpler cousin, the holdout test, does the same thing with one region switched off instead of a carefully matched pair. For DTC brands spending a few thousand dollars a month, it is usually the most honest way to answer whether a channel is actually generating sales or just taking credit for orders that would have happened anyway. No enterprise media mix model required.
If you have ever looked at a Meta dashboard claiming a 6x ROAS while your bank account suggests otherwise, you already understand why incrementality testing exists. The problem has always been access: media mix modeling was built for brands with eight-figure media budgets and a data team. That has changed, and access is no longer the obstacle it used to be. What matters now is the mechanics: what a geo-lift test actually measures, the spend level where it starts producing a readable result, how to design and track one without quietly invalidating it, and how to calculate incremental lift from your own numbers.
A geo-lift test is a controlled experiment where you run ads in one set of geographic markets (the treatment group) and pause or reduce them in another comparable set (the control group), then measure the difference in conversions or revenue between the two over a fixed window. The gap between them, adjusted for how those markets performed relative to each other before the test, is your incremental lift. You can run a usable one on a few thousand dollars a month of spend, though as I will explain later, the readings get a lot cleaner once you are past roughly $15,000 a month.
Before we get into statistics, we need to agree on what we are counting. The mechanics are simple enough: two groups of regions, one with media pressure and one without, measured over the same period. The complication is that “conversions in a geo” is a measurement decision, not a fact that arrives pre-packaged in your reports. Are you counting sessions whose IP address resolves to that region, or orders whose shipping address sits there? Those are different numbers, and the difference is big enough to change your conclusion.
A geo-lift test is easy to confuse with two other methods, and the differences matter. Platform conversion lift studies are run by the platform, cover a single channel, and are graded by the same system that sells you the media. Standard A/B testing works at the user level, which is fine on a landing page where you control the split, but you cannot randomize individuals across paid media channels in any reliable way. That is also why matched market testing and holdout test marketing keep coming back into fashion: geography is one of the few variables you can still split cleanly. If you are still relying on last-click or a platform’s default model to make budget calls, our guide to advanced attribution models for eCommerce is a useful companion read, because lift testing answers a question attribution models structurally cannot.
Classic MMM was out of reach for sub-$20M brands for three practical reasons. It wants two to three years of weekly data across every channel, it needs an analyst (internal or rented) to build and maintain the model, and the first usable output tends to arrive months after the kickoff call. For a Shopify brand changing creative every two weeks, paying for a model that reports on last year’s media is a hard sell.
What changed is tooling. Meta open-sourced GeoLift, an R package that handles market selection and significance testing for exactly this kind of experiment. Google Ads has geo experiments built into the campaign interface. Several measurement vendors now sell self-serve geo testing at a monthly price a scaling brand can actually approve. The data requirement dropped from years of history to a few months, and the test cycle from quarters to weeks.
Here are the rules of thumb I work with, based on tests we have run for brands in the $15,000 to $50,000 per month ad spend range. Below roughly $5,000 a month, a geo-lift test will technically run but the noise usually swamps the signal: you need an enormous effect (40% or more) to see anything above weekly variance. Between $5,000 and $15,000 a month, you can get a directional read if you widen the test window and keep the geo groups large. Above $15,000 a month, with at least 100 to 150 orders per week in the control group, a 10% to 15% lift starts becoming detectable.
This is the point where people get discouraged, because they expected lab-grade precision and got a confidence interval wide enough to drive a truck through. My honest take: directional confidence is usually enough to make a budget decision. Knowing that your incremental ROAS sits somewhere between 1.2 and 1.8 when the platform claims 4.5 already tells you enough to make the call. Waiting for academic significance on a $10,000 monthly budget means waiting forever.

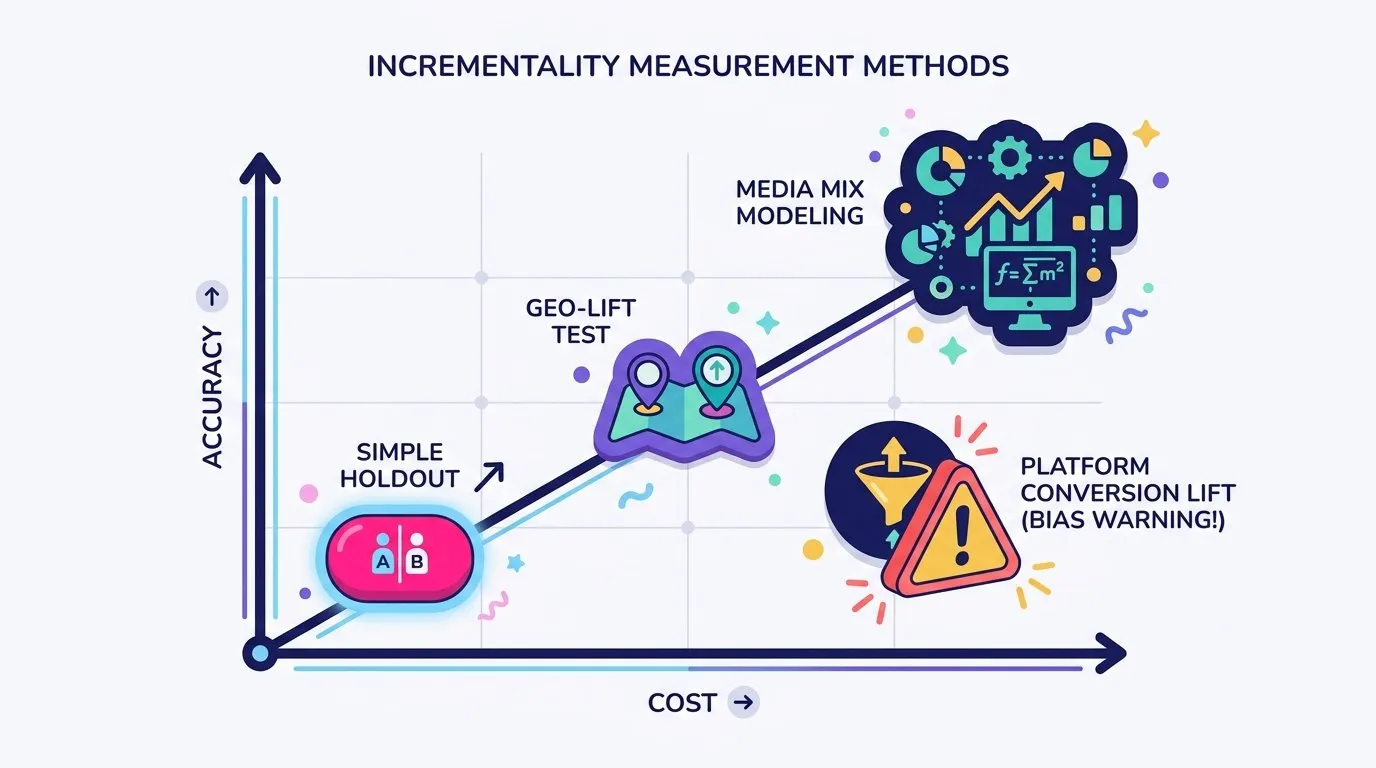
These four methods sit on a spectrum from quick and scrappy to comprehensive and expensive. Choosing between them comes down to the money and time you actually have, more than to which one sounds most rigorous on paper. In chess, you pick an opening that suits the position in front of you, not the one that looks most sophisticated on the board, and measurement methods work the same way.
| Method | Cost | Minimum monthly spend | Setup time | Accuracy | Best for |
|---|---|---|---|---|---|
| Simple holdout | Near zero (lost revenue in holdout) | $5K | 1 week | Directional | First honest read on one channel |
| Geo-lift test | Low to medium | $15K | 2-3 weeks | Good on a single channel | Validating a channel’s incremental ROAS |
| Platform conversion lift | Free, platform-run | Varies by platform | Days | Biased toward the platform | Quick sanity check, not a verdict |
| Media mix modeling | High | $200K+ | 2-4 months | Good across all channels | Ongoing multi-channel budget allocation |
The row DTC managers misjudge most is platform conversion lift. It looks like the free option, and in cash terms it is, but the platform defines the control group, counts the conversions and reports the result. It is a conflict of interest baked into the design, not outright fraud. The other commonly underestimated line is the simple holdout: turning ads off in one region for four weeks costs you real revenue, and you should budget for that loss the way you would budget for any other experiment.
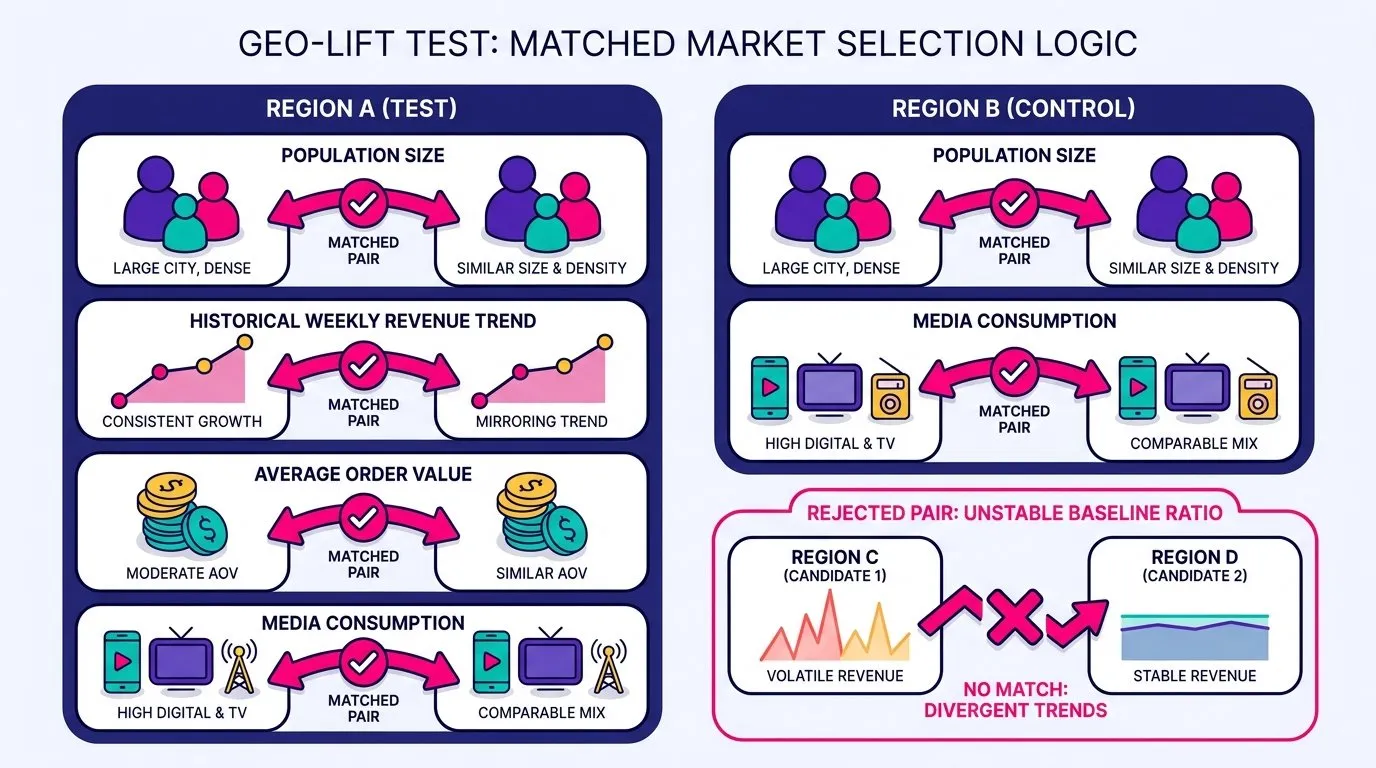
Two geos are comparable when they behave similarly before you touch anything. In practice that means similar population and customer base size, similar historical revenue trends week over week, similar AOV, and similar media consumption patterns. The test works because the control group tells you what the treatment group would have done without ads, and that only holds if the two moved together in the past.
Mismatched pairs are the quietest way to ruin a test. If your treatment geo contains the city where you did a pop-up last spring and your control geo does not, the baseline relationship between them is unstable and every number downstream inherits that instability. I pull at least 12 weeks of pre-period revenue by region before agreeing to a market split, and if the weekly ratio between the two groups bounces around by more than a few percentage points, I look for a different pairing.
Four to six weeks is the window I would aim for. Shorter than four and you are reading noise, especially in categories with long consideration cycles. Much longer than six and you accumulate external events that have nothing to do with your media. Then there is the calendar problem: I am regularly asked whether we can start a test next week, and sometimes the answer is no, not during Black Friday week, not during a regional holiday, and not while a sitewide promo is running in one region and not the other. Weather-driven categories deserve extra caution, since a cold snap can move wellness and skincare revenue more than your ads do.
Geo-lift testing is a different animal from the creative and landing page tests most teams run weekly, but they complement each other well. If you want the user-level side of the picture, our Google Ads A/B testing guide covers that territory.
Here is the failure mode I see most. The test design is sound, the markets are matched, and the geo dimension used in the analysis comes from IP-inferred location in the analytics platform. IP geolocation is approximate, it degrades on mobile networks, and it has nothing to do with where the order ships. So a customer who lives in a control region but browses on a work network in a treatment region lands in the wrong bucket, and nobody notices.
The fix is to pass a verified geo dimension yourself. Where the data exists, send the shipping or billing region from the Shopify order into the data layer and capture it in Google Tag Manager as a custom dimension on the purchase event, rather than relying on browser or platform defaults. It takes an afternoon to implement and it is the single highest-return hour of work in the whole project, because every number you report afterwards depends on it.
UTM hygiene matters for the same reason. If UTMs change mid-test, or some campaigns carry them and others do not, you cannot cleanly separate treatment traffic from control traffic in GA4 afterwards. Lock your naming convention before the test starts and resist the urge to “improve” it while the experiment is live. If your tracking foundation is not solid yet, start with our primer on what web analytics is and how to track website performance before you commit budget to an experiment.
When the results come in, expect Meta and Google to report a larger effect than your own analysis does. Both platforms use view-through windows and click attribution models designed to capture everything plausibly connected to an impression, which is a reasonable thing for a platform to do and a terrible basis for a causal read. GA4 should be the tie-breaker for the treatment versus control comparison, because it is the only source counting both groups the same way. For a behavioral sanity check between regions, Microsoft Clarity recordings and heatmaps are useful too: if conversion rates diverge but on-site behavior is identical, the divergence is probably in your tracking, not your customers.
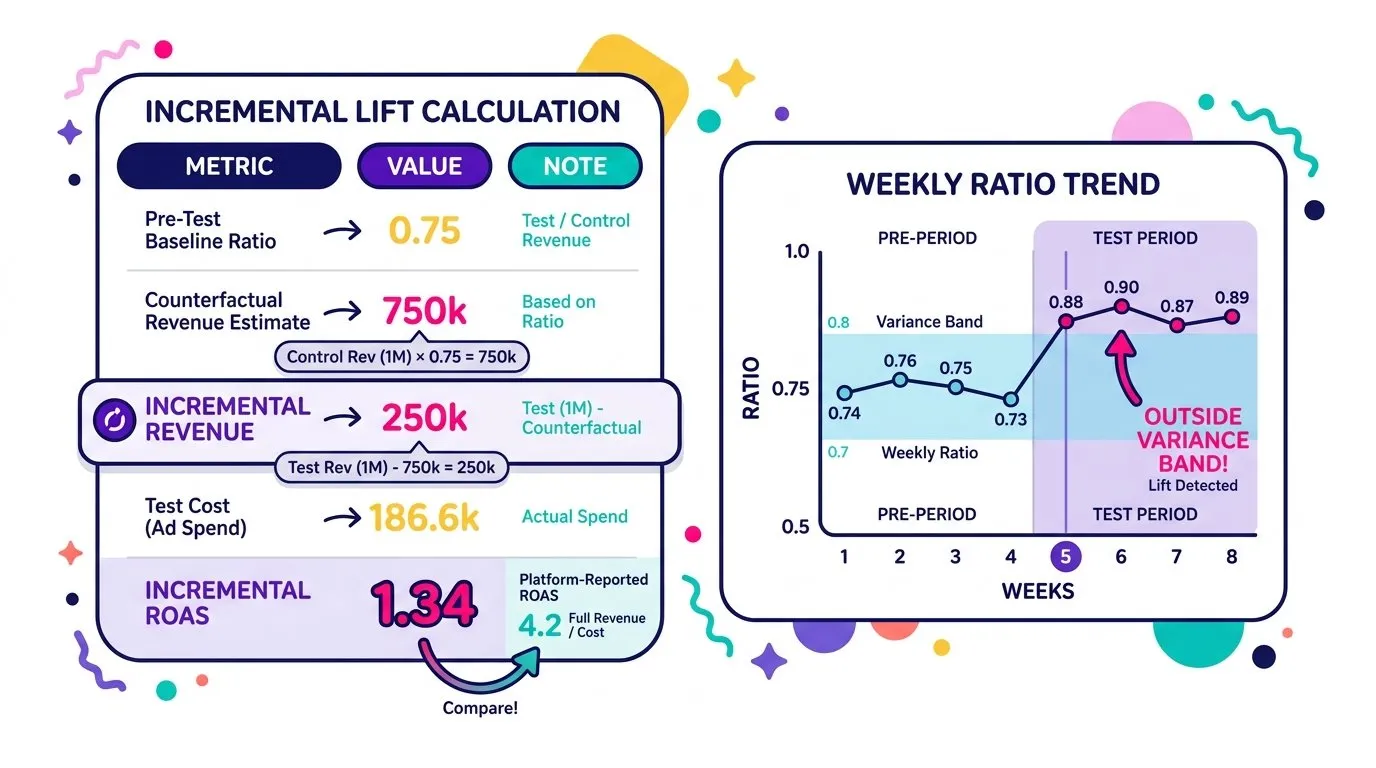
The core calculation is a subtraction with one adjustment. You take the revenue the treatment group generated during the test, estimate what it would have generated without ads by scaling the control group’s test revenue by the pre-period relationship between the two, and the difference is your incremental revenue. Divide that by the spend in the treatment geos and you have incremental ROAS, which is the number that should inform budget decisions. Compare it against your break-even ROAS rather than against the platform’s figure, and the picture usually gets a lot clearer.
Let us walk through a four-week test for a beauty brand, the way I would if we were looking at your spreadsheet together.
| Metric | Treatment geos | Control geos |
|---|---|---|
| Pre-test revenue, 4 weeks, ads on in both | $52,000 | $47,000 |
| Test revenue, 4 weeks, ads paused in control | $61,000 | $44,000 |
| Ad spend during test | $9,000 | $0 |
| Platform-reported revenue in treatment | $38,000 | n/a |
The baseline ratio is 47,000 divided by 52,000, or 0.90: the control group historically produces 90 cents for every dollar the treatment group produces. Scaling the control group’s test revenue back up gives the counterfactual: 44,000 divided by 0.90 equals roughly $48,900, which is what the treatment geos would plausibly have earned with ads off. Actual treatment revenue was $61,000, so incremental revenue is about $12,100. Against $9,000 of spend, that is an incremental ROAS of 1.34, while the platform is reporting 4.2.
For the significance check, you do not need a statistics degree, you need weekly data. Pull the control-to-treatment revenue ratio for each of the 12 weeks before the test. If it sat between 0.86 and 0.94, and during the test it dropped to 0.70 to 0.74 every single week, the effect is sitting well outside normal variation and you can act on it. If the test-period ratios overlap with the pre-period range, you have an inconclusive test, which is a real result and should be reported as one. Running the same data through GeoLift will give you a formal p-value, but the weekly-ratio check tells you most of what you need before you get there.
Geo contamination is the first one. Shoppers travel, they ship gifts to other regions, they use VPNs, and they order from a phone on a cellular network that resolves hundreds of kilometers from home. None of this is avoidable, which is why you use order-level shipping geo where you can and pick geo groups large enough that the leakage is a small percentage of the total. Tight, adjacent markets leak more than distant, well-separated ones.
The second is letting the platform grade its own homework. Layering self-attributed conversion data on top of an already noisy test gives you a result that feels precise and is systematically inflated. If the platform’s lift number and your own calculation disagree, the disagreement itself is the finding, and it usually means your true channel contribution is lower than your media plan assumes. Brands that discover this mid-scale often need to rebuild the budget split from scratch, and our notes on PPC management for small businesses cover how to reallocate without stalling growth.
The third is everything else that happened during your test window. A competitor promo, an unexpected press mention, a stockout on your hero SKU, a shipping delay in one region: all of these move revenue and none of them are your ads. Keep a simple log of external events during the test, note them against the weekly data, and be willing to throw out a week. Most of the invalidated tests clients bring to me were designed fine. The tracking, or the event log, was the part nobody set up.
That is why we treat a geo-lift test as a measurement project with a media component, not the other way round. The first week is spent on data, not ads: pulling regional revenue history from Shopify, checking that the geo dimension in GA4 reflects order data rather than IP guesses, auditing UTM consistency across campaigns, and building the market pairs from the pre-period ratios. If that audit turns up broken tracking, we fix the tracking before anyone touches a campaign, because a test built on bad data costs the same and tells you nothing.
During the test we hold the setup still and monitor the weekly ratio rather than the platform dashboards, then report two numbers side by side at read-out: the incremental ROAS from the geo comparison and the platform-reported figure, with the gap between them stated plainly. Where a client runs frequent experiments, we automate the weekly data pull into a Looker Studio view with Make, so the read is ready the day the test ends instead of two weeks later.
A few signals tell you that single-channel geo tests have stopped being enough. You are running four or more channels that interact with each other, so isolating one at a time no longer reflects how the mix behaves. Your spend has grown to the point where pausing ads in a control region costs more than the insight is worth. Or you need measurement that updates continuously for budget planning, not a one-off answer per quarter.
MMM is not a better version of geo-lift testing, it is a tool for a different stage. The useful part is that everything you built for your geo tests (clean regional data, consistent UTMs, verified order geography, a habit of logging external events) is exactly what a model will need as input. Brands that run geo tests for a year arrive at their first MMM engagement with usable data instead of a cleanup project. If you are in that growth phase now, our guide to scaling ROAS-positive digital ads pairs well with your first lift results.
You do not need a six-figure measurement stack to get an honest answer about what your advertising adds. A well-tracked holdout, run for four weeks on markets you picked carefully, gets you most of the way to the same conclusion an expensive model would reach, and it gets you there in a month. Pair it with a blended view of efficiency, our MER calculator is a quick way to start, and you have a reasonable read on both channel contribution and total marketing efficiency.
The barrier here was never the statistics. The arithmetic in this article is subtraction and division, and the tooling is free or close to it. The barrier is tracking discipline: verified geo data, stable UTMs, a clean baseline and the patience to leave the setup alone for a month. That is all fixable, usually in an afternoon of tag work, and once it is fixed you can keep running these tests for as long as you keep spending money on media.
Want to know what your ads are really contributing? Take a look at our web analytics services or ask us for a tracking audit.
We will check how your geo and conversion data is actually being captured, fix what would break a lift test, and help you design the first experiment worth running.